
The last decade has been filled with school
reform. So, how are these reforms working? Our leaders in education—I mean people who give advice rather than teach—have been pushing standardized tests! Yep, our leaders
love them.
The testing companies love them too.
Thirteen years have passed since Congress enacted No Child
Left Behind. Remember that great law! One bold promise wrapped in 1,100 pages
of jargon and buried in bureaucratic detail. You know the promise: Every child would be
proficient in reading and math by—well—2014. Remember all the tests tied to
that law? Okay, those tests are gone. No problem! We now have Common Core and another round of fresh tests coming our way.
By now we might be excused for expecting the ripe fruits of reform to be ready for picking. Let’s see how America’s college-bound kids
are doing.
First, consider American College Testing (ACT) scores for the last two decades.
Um…average reading scores for the 2012 graduating class were
no higher than scores for the class of 1995. In science the class of 2012 did
no better than the class of 1994. The average English score in 1999, three
years before passage of No Child Left Behind, was the same as today. Only math
scores are up in any statistically significant way.
How about writing? Writing ability seems to be plunging,
perhaps because “standardized writing” is hard even to imagine.
(CLICK ON TABLE BELOW TO EXPAND.)

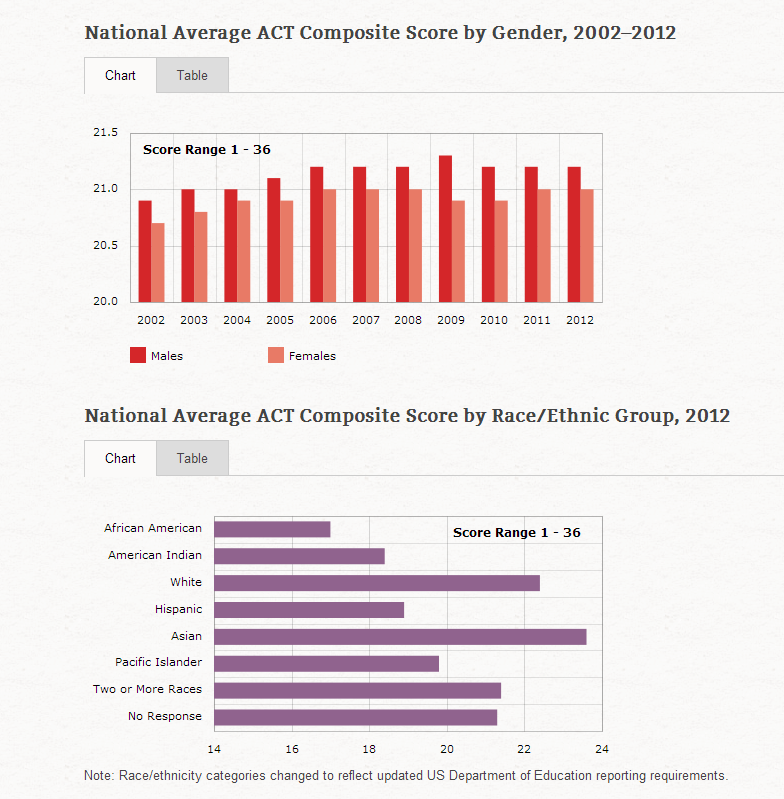
Maybe testing helped close the gender gap.
Nope it hasn’t. The gender gap has been consistent for years, hovering just around .2 annually. Males had an average composite score of 21.2 in 2012, females 21.0.
What about a secondary promise of No Child Left Behind? That a focus on testing would eliminate the racial gap?
What about a secondary promise of No Child Left Behind? That a focus on testing would eliminate the racial gap?
Also not working!
The average score by race in 2012—which correlates almost
perfectly with average poverty rates by racial group—is as follows:
African-American: 17.0
American-Indian: 18.4
White 22.4
Hispanic 18.9
Asian 23.6
Pacific Islander 19.8
Two or More Races 21.4
No Response 21.3
(CLICK ON TABLE BELOW TO EXPAND.)
What do the figures for the Scholastic Aptitude Tests (SAT’s) show? Huge gains you figure. All these great reforms! Let’s check those gains out.
(CLICK TO EXPAND.)

Well, isn’t that depressing! You almost get the feeling reformers who push standardized testing don’t know what learning is really about.
Math scores for seniors interested in attending colleges and
universities are down 9 points since NCLB was made law. Reading scores are down
5. Writing scores again seem to be falling fastest. The writing test was new in 200d and scores are down 9 in six years.
How about the “racial and gender gaps” that No Child Left
Behind was supposed to fix? What does the latest evidence show? Good news, I guess.
Male and female students are getting worse scores, but doing
it equally. Total scores for both sexes are down 20 points.
With the exception of one racial group, all are
performing equally. That is: scores are in decline.White kids are down (-6 points). So are African-American kids (-13), Mexican
American kids (-16), Puerto Rican kids (-9) and Other Hispanic kids (-17).
It’s a debacle.
Only Asian, Asian-American and Pacific Islander kids (all one category for SAT) are
doing better. Oddly enough, their scores have increased, in the three tested areas, by a combined 45
points.
(PLEASE CLICK TABLE TO EXPAND.)

How are all the reforms working? Well, terrible, I think you might say. The National Center for Fair and Open Testing adds this note of warning: “Doubling down on unsuccessful policies with more high-stakes K-12 testing, as Common Core exam proponents propose, is an exercise in futility, not meaningful school improvement.”
See also:
http://www.act.org/newsroom/data/1998/tsum.html
http://www.act.org/newsroom/data/2002/pdf/tsum.pdf
http://www.act.org/newsroom/data/2012/trends.html

